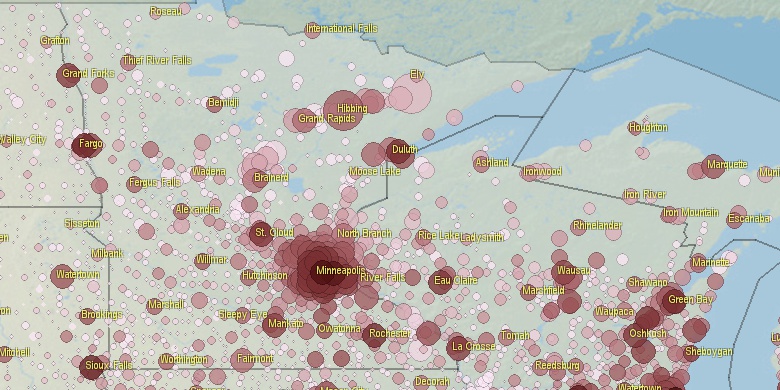
Last official estimated population of Minong village (Washburn County**, Wisconsin state) was 512 (year 2014)[1]. This was 0% of total US population and 0.01% of total Wisconsin state population. Area of Minong village is 1.5 mi² (=3.9 km²)[6], in this year population density was 342.70 p/mi². If population growth rate would be same as in period 2010-2014 (-0.72%/yr), Minong village population in 2026 would be 470*.
Historical population of Minong village for period 1920-2014:
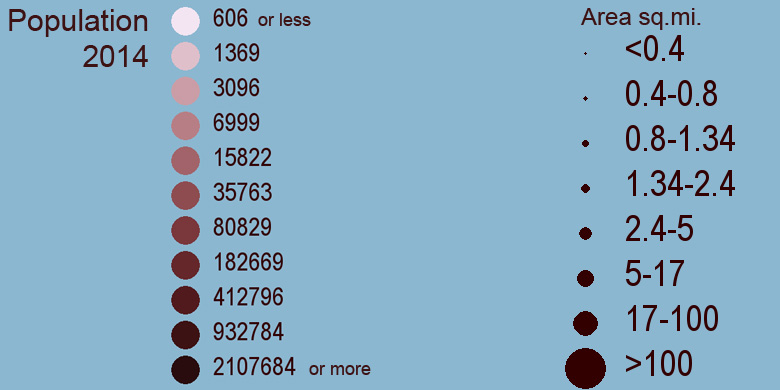
Estimated population for 2014[1]. Click on flag to hide it.
Population • Legends • Position

[1920-1930] +2.42 %/yr
[1930-1940] +0.53 %/yr
[1940-1950] +1.49 %/yr
[1950-1960] -0.26 %/yr
[1960-1970] +1.9 %/yr
[1970-1980] +2.86 %/yr
[1980-1990] +0.63 %/yr
[1990-2000] -1.04 %/yr
[2000-2005] +0.04 %/yr
[2005-2010] -0.3 %/yr
[2010-2014] -0.72 %/yr
• Spooner city population
19 mi,  188°
188°
• Hayward city
17.5 mi,  110°
110°
• Shell Lake city
26 mi, 188°
• Lake Nebagamon village
28.3 mi,  11°
11°
• Webster village
29.8 mi,  239°
239°
• Solon Springs village
17.3 mi,  359°
359°
• Poplar village
33.5 mi,  3°
3°
• Birchwood village
33.2 mi,  156°
156°
• Haugen village
33.9 mi,  176°
176°
• Couderay village
32.8 mi,  129°
129°
*Calculated by population.us from last known population growth rate, not official data.
**Some cities are placed on more than one county. Only 1 county is shown.
[1] Cities and Towns (Incorporated Places and Minor Civil Divisions) 2014, archived from the original, retrieved 02/23/2016
[2] City and Town Intercensal Estimates (2000-2010), archived from the original, retrieved 02/23/2016
[3] Places: 1990 and 1999 Populations, With Numeric and Percent Population Change, archived from the original, retrieved 02/23/2016
[4] Population of the 100 Largest Urban Places: 1980,
[5] Population of the 100 Largest Urban Places in history,
[6] Area, latitude longitude data, retrieved 02/23/2016
[7] Through the Decades, Overview 1790-2010, PDF, large files! >100 Mb
Page generated in 0.03 seconds© 2016 population.us | Terms of use | Contact