Last official estimated population of Clark County was 980 (year 2014)[1]. This was 0% of total US population and 0.1% of total Idaho state population. Area of Clark County is 1,764.4 mi² (=4569.7 km²), in this year population density was 0.56 p/mi². If population growth rate would be same as in period 2010-2014 (-0.05%/yr), Clark County population in 2026 would be 974 [0].
Historical population of Clark County for period 1920-2014 [1] , [2] , [3]:
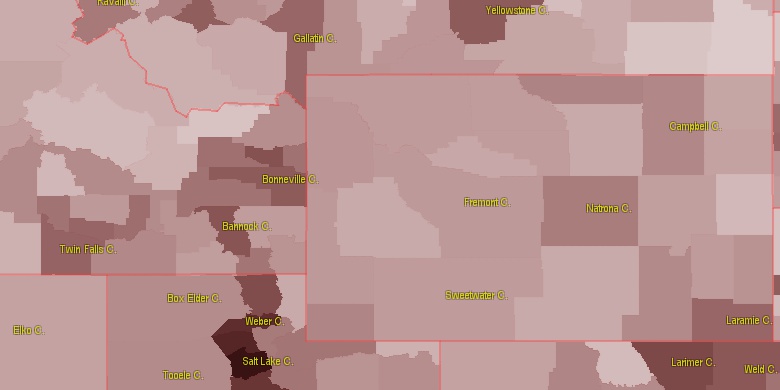
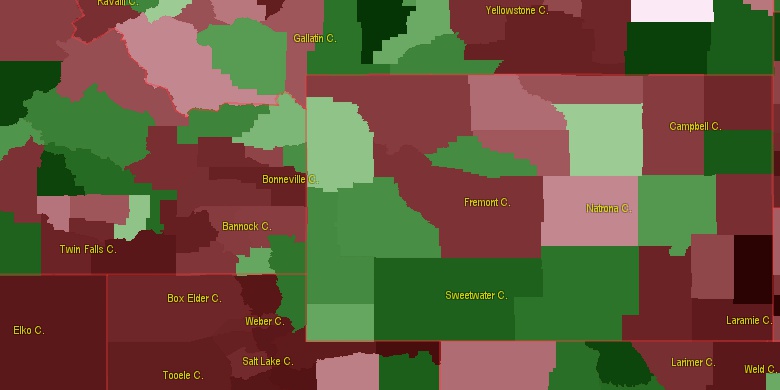
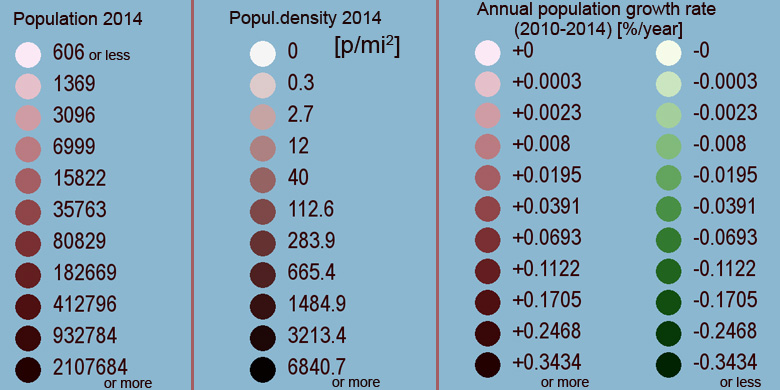
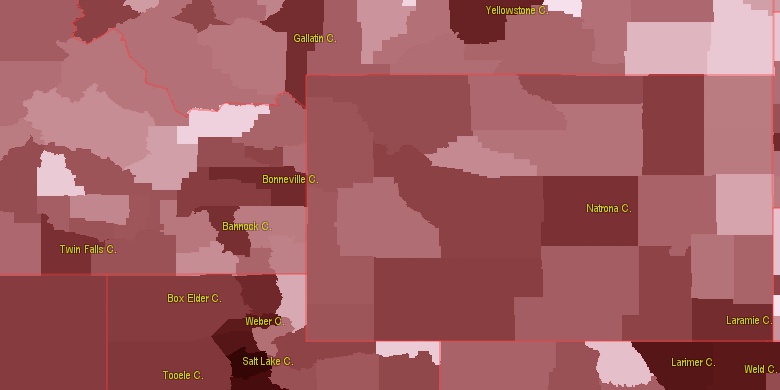
Estimated population for 2014[1]. Population density is in p./sq.mi [4]. Changes are for period 2010-2015. Value is %/year. Boundary lines are approx. 2012 [5]. Click on flag to hide it.
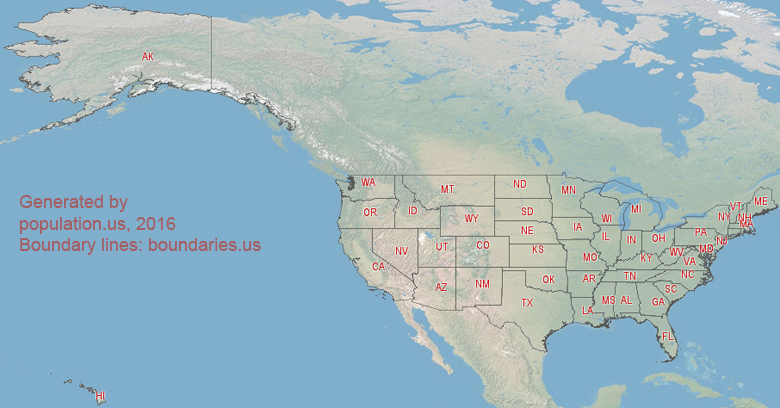
Population • Density • Changes • Legends • Position

[1920-1930] -5.06 %/yr
[1930-1940] -1.1 %/yr
[1940-1950] -0.9 %/yr
[1950-1960] -0.03 %/yr
[1960-1970] -2.09 %/yr
[1970-1980] +0.74 %/yr
[1980-1990] -0.46 %/yr
[1990-2000] +2.98 %/yr
[2000-2005] -1.97 %/yr
[2005-2010] +1.2 %/yr
[2010-2014] -0.05 %/yr
Looking for settlements in Clark County? Visit this page: Settlements in Clark County, ID
Population of Clark County by age groups male (M) and female (F)[1b]
| Age Gr. | (M) | (F) | Total |
| 0 to 4 | 24 | 27 | 51 |
| 5 to 9 | 39 | 34 | 73 |
| 10 to 14 | 37 | 39 | 76 |
| 15 to 19 | 33 | 37 | 70 |
| 20 to 24 | 23 | 23 | 46 |
| 25 to 29 | 39 | 17 | 56 |
| 30 to 34 | 35 | 24 | 59 |
| 35 to 39 | 17 | 26 | 43 |
| 40 to 44 | 29 | 24 | 53 |
| 45 to 49 | 27 | 27 | 54 |
| 50 to 54 | 25 | 30 | 55 |
| 55 to 59 | 38 | 16 | 54 |
| 60 to 64 | 28 | 21 | 49 |
| 65 to 69 | 17 | 22 | 39 |
| 70 to 74 | 14 | 14 | 28 |
| 75 to 79 | 14 | 14 | 28 |
| 80 to 84 | 10 | 12 | 22 |
| 85+ | 8 | 3 | 11 |
Clark County resident population estimates by Sex, Race, and Hispanic Origin[1b]. For full list of abbrevations see: population.us/about page.
| Race | Male | Female | Total |
| WAC | 438 | 392 | 830 |
| WA | 430 | 381 | 811 |
| NH | 261 | 237 | 498 |
| NHWAC | 253 | 229 | 482 |
| NHWA | 247 | 221 | 468 |
| H | 196 | 173 | 369 |
| HWAC | 185 | 163 | 348 |
| HWA | 183 | 160 | 343 |
| IAC | 14 | 19 | 33 |
| TOM | 8 | 13 | 21 |
| IA | 8 | 11 | 19 |
| HIAC | 7 | 11 | 18 |
| NHIAC | 7 | 8 | 15 |
| NHTOM | 6 | 9 | 15 |
| BAC | 8 | 6 | 14 |
| HIA | 5 | 8 | 13 |
| AAC | 7 | 5 | 12 |
| AA | 6 | 3 | 9 |
| NHBAC | 4 | 5 | 9 |
| NHAAC | 5 | 3 | 8 |
| BA | 5 | 2 | 7 |
| NHAA | 4 | 2 | 6 |
| NHIA | 3 | 3 | 6 |
| HTOM | 2 | 4 | 6 |
| HBAC | 4 | 1 | 5 |
| HBA | 4 | 0 | 4 |
| HAAC | 2 | 2 | 4 |
| HAA | 2 | 1 | 3 |
| NHBA | 1 | 2 | 3 |
| NAC | 0 | 1 | 1 |
| NHNAC | 0 | 1 | 1 |
| HNAC | 0 | 0 | 0 |
| NHNA | 0 | 0 | 0 |
| HNA | 0 | 0 | 0 |
| NA | 0 | 0 | 0 |
• Bonneville County population
71.8 mi,  149°
149°
• Bingham County
74.2 mi,  181°
181°
• Madison County
49 mi,  135°
135°
• Jefferson County
34.1 mi, 176°
• Fremont County
43.3 mi,  96°
96°
• Teton County
67.5 mi,  122°
122°
• Beaverhead County
64 mi,  335°
335°
• Lemhi County
87.3 mi,  300°
300°
• Madison County
74.7 mi,  16°
16°
• Butte County
58.5 mi,  224°
224°
[0] Calculated by population.us from last known population growth rate, not official data.
[1] County population - 2014, archived from the original, retrieved 02/23/2016
[1b] Annual County Resident Population Estimates by Age, Sex, Race, and Hispanic Origin, (used only data for 2014) archived from the original, retrieved 02/23/2016
[2] County population - 2000-2010, archived from the original, retrieved 02/23/2016
[3] Population of States and Counties of the United States: 1790 to 1992, PDF, 15 Mb, census.gov, retrieved 02/23/2016
[4] County area, latitude longitude data, retrieved 02/23/2016
[5] County boundaries, CSV files on boundaries.us, retrived 03/18/2016
*Fremont Idaho Notes
Page generated in 0.018 seconds© 2016 population.us | Terms of use | Contact