Last official estimated population of Lemhi County was 7,946 (year 2014)[1]. This was 0.002% of total US population and 0.5% of total Idaho state population. Area of Lemhi County is 4,568.7 mi² (=11832.8 km²), in this year population density was 1.74 p/mi². If population growth rate would be same as in period 2010-2014 (+0.03%/yr), Lemhi County population in 2026 would be 7,976 [0].
Historical population of Lemhi County for period 1870-2014 [1] , [2] , [3]:
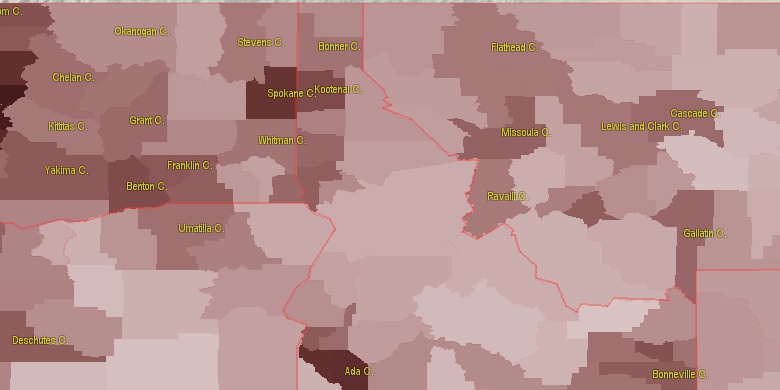
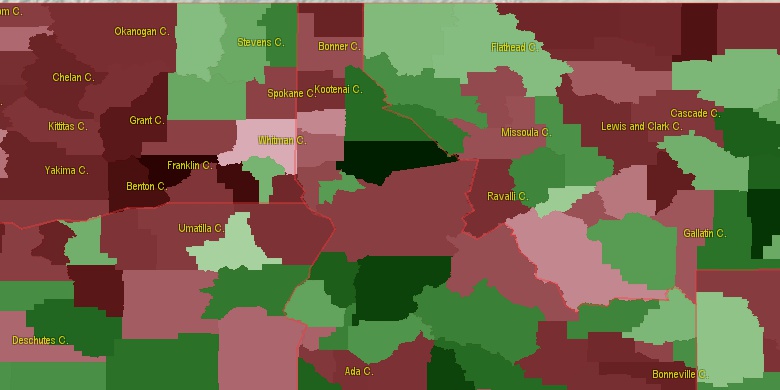
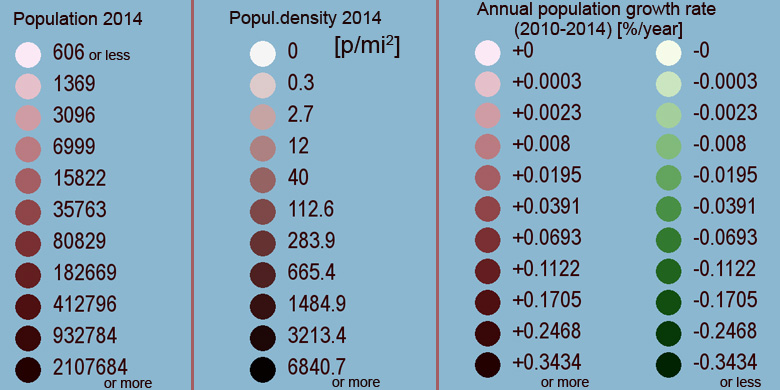
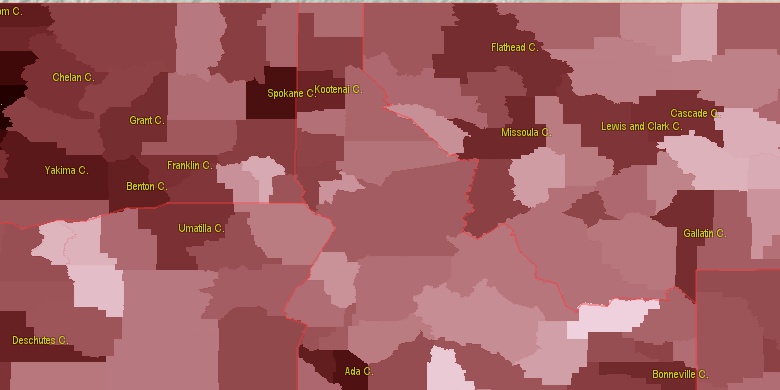
Estimated population for 2014[1]. Population density is in p./sq.mi [4]. Changes are for period 2010-2015. Value is %/year. Boundary lines are approx. 2012 [5]. Click on flag to hide it.
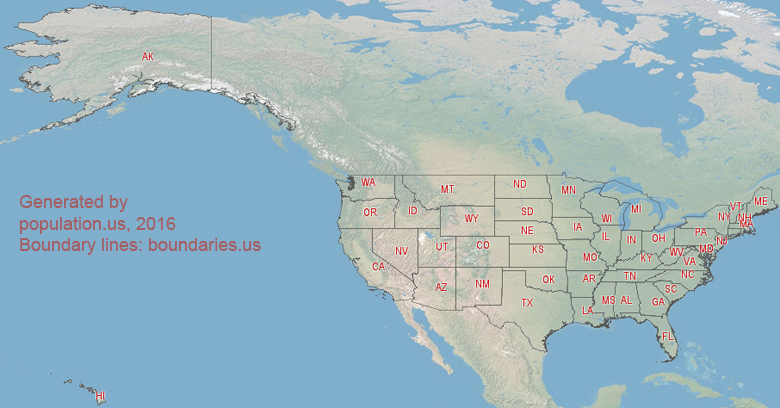
Population • Density • Changes • Legends • Position

[1870-1880] +8.48 %/yr
[1880-1890] -1.51 %/yr
[1890-1900] +6.05 %/yr
[1900-1910] +3.34 %/yr
[1910-1920] +0.76 %/yr
[1920-1930] -1.06 %/yr
[1930-1940] +3.46 %/yr
[1940-1950] -0.38 %/yr
[1950-1960] -0.76 %/yr
[1960-1970] -0.44 %/yr
[1970-1980] +2.97 %/yr
[1980-1990] -0.78 %/yr
[1990-2000] +1.23 %/yr
[2000-2005] -0.23 %/yr
[2005-2010] +0.58 %/yr
[2010-2014] +0.03 %/yr
Looking for settlements in Lemhi County? Visit this page: Settlements in Lemhi County, ID
Population of Lemhi County by age groups male (M) and female (F)[1b]
| Age Gr. | (M) | (F) | Total |
| 0 to 4 | 158 | 153 | 311 |
| 5 to 9 | 207 | 206 | 413 |
| 10 to 14 | 208 | 204 | 412 |
| 15 to 19 | 226 | 167 | 393 |
| 20 to 24 | 168 | 136 | 304 |
| 25 to 29 | 154 | 155 | 309 |
| 30 to 34 | 194 | 205 | 399 |
| 35 to 39 | 176 | 165 | 341 |
| 40 to 44 | 165 | 171 | 336 |
| 45 to 49 | 193 | 209 | 402 |
| 50 to 54 | 285 | 292 | 577 |
| 55 to 59 | 332 | 365 | 697 |
| 60 to 64 | 360 | 361 | 721 |
| 65 to 69 | 369 | 325 | 694 |
| 70 to 74 | 309 | 265 | 574 |
| 75 to 79 | 194 | 176 | 370 |
| 80 to 84 | 113 | 105 | 218 |
| 85+ | 107 | 148 | 255 |
Lemhi County resident population estimates by Sex, Race, and Hispanic Origin[1b]. For full list of abbrevations see: population.us/about page.
| Race | Male | Female | Total |
| WAC | 3844 | 3705 | 7,549 |
| NH | 3800 | 3686 | 7,486 |
| WA | 3765 | 3634 | 7,399 |
| NHWAC | 3743 | 3597 | 7,340 |
| NHWA | 3674 | 3534 | 7,208 |
| H | 118 | 122 | 240 |
| HWAC | 101 | 108 | 209 |
| HWA | 91 | 100 | 191 |
| IAC | 84 | 97 | 181 |
| TOM | 82 | 73 | 155 |
| NHIAC | 67 | 81 | 148 |
| NHTOM | 70 | 64 | 134 |
| IA | 41 | 48 | 89 |
| BAC | 37 | 37 | 74 |
| AAC | 34 | 38 | 72 |
| NHIA | 31 | 37 | 68 |
| NHBAC | 32 | 33 | 65 |
| NHAAC | 25 | 34 | 59 |
| AA | 16 | 27 | 43 |
| BA | 13 | 25 | 38 |
| NHAA | 12 | 26 | 38 |
| NHBA | 12 | 24 | 36 |
| HIAC | 17 | 16 | 33 |
| HTOM | 12 | 9 | 21 |
| HIA | 10 | 11 | 21 |
| HAAC | 9 | 4 | 13 |
| NAC | 6 | 6 | 12 |
| NHNAC | 6 | 6 | 12 |
| HBAC | 5 | 4 | 9 |
| HAA | 4 | 1 | 5 |
| NA | 1 | 1 | 2 |
| HBA | 1 | 1 | 2 |
| NHNA | 1 | 1 | 2 |
| HNAC | 0 | 0 | 0 |
| HNA | 0 | 0 | 0 |
• Ravalli County population
80.3 mi,  351°
351°
• Silver Bow County
89.5 mi,  41°
41°
• Idaho County
99.6 mi,  309°
309°
• Valley County
86.4 mi,  262°
262°
• Deer Lodge County
88.3 mi,  24°
24°
• Beaverhead County
50.6 mi,  73°
73°
• Madison County
100 mi, 74°
• Custer County
48.7 mi,  201°
201°
• Butte County
92.8 mi,  157°
157°
• Clark County
87.3 mi,  120°
120°
[0] Calculated by population.us from last known population growth rate, not official data.
[1] County population - 2014, archived from the original, retrieved 02/23/2016
[1b] Annual County Resident Population Estimates by Age, Sex, Race, and Hispanic Origin, (used only data for 2014) archived from the original, retrieved 02/23/2016
[2] County population - 2000-2010, archived from the original, retrieved 02/23/2016
[3] Population of States and Counties of the United States: 1790 to 1992, PDF, 15 Mb, census.gov, retrieved 02/23/2016
[4] County area, latitude longitude data, retrieved 02/23/2016
[5] County boundaries, CSV files on boundaries.us, retrived 03/18/2016
Page generated in 0.016 seconds© 2016 population.us | Terms of use | Contact